Your IA analysis, done the way the examiner marks it.
Paste your raw data. Get propagated uncertainties, a graph with error bars, best-fit plus max/min gradient lines, gradient ± uncertainty, and a results table you can drop straight into your write-up.
Get the toolkit — $19Teacher class licence — $39Excel workbook + Google Sheets instructions + PDF guide. Instant download. 14-day refund if it doesn't produce your graph.
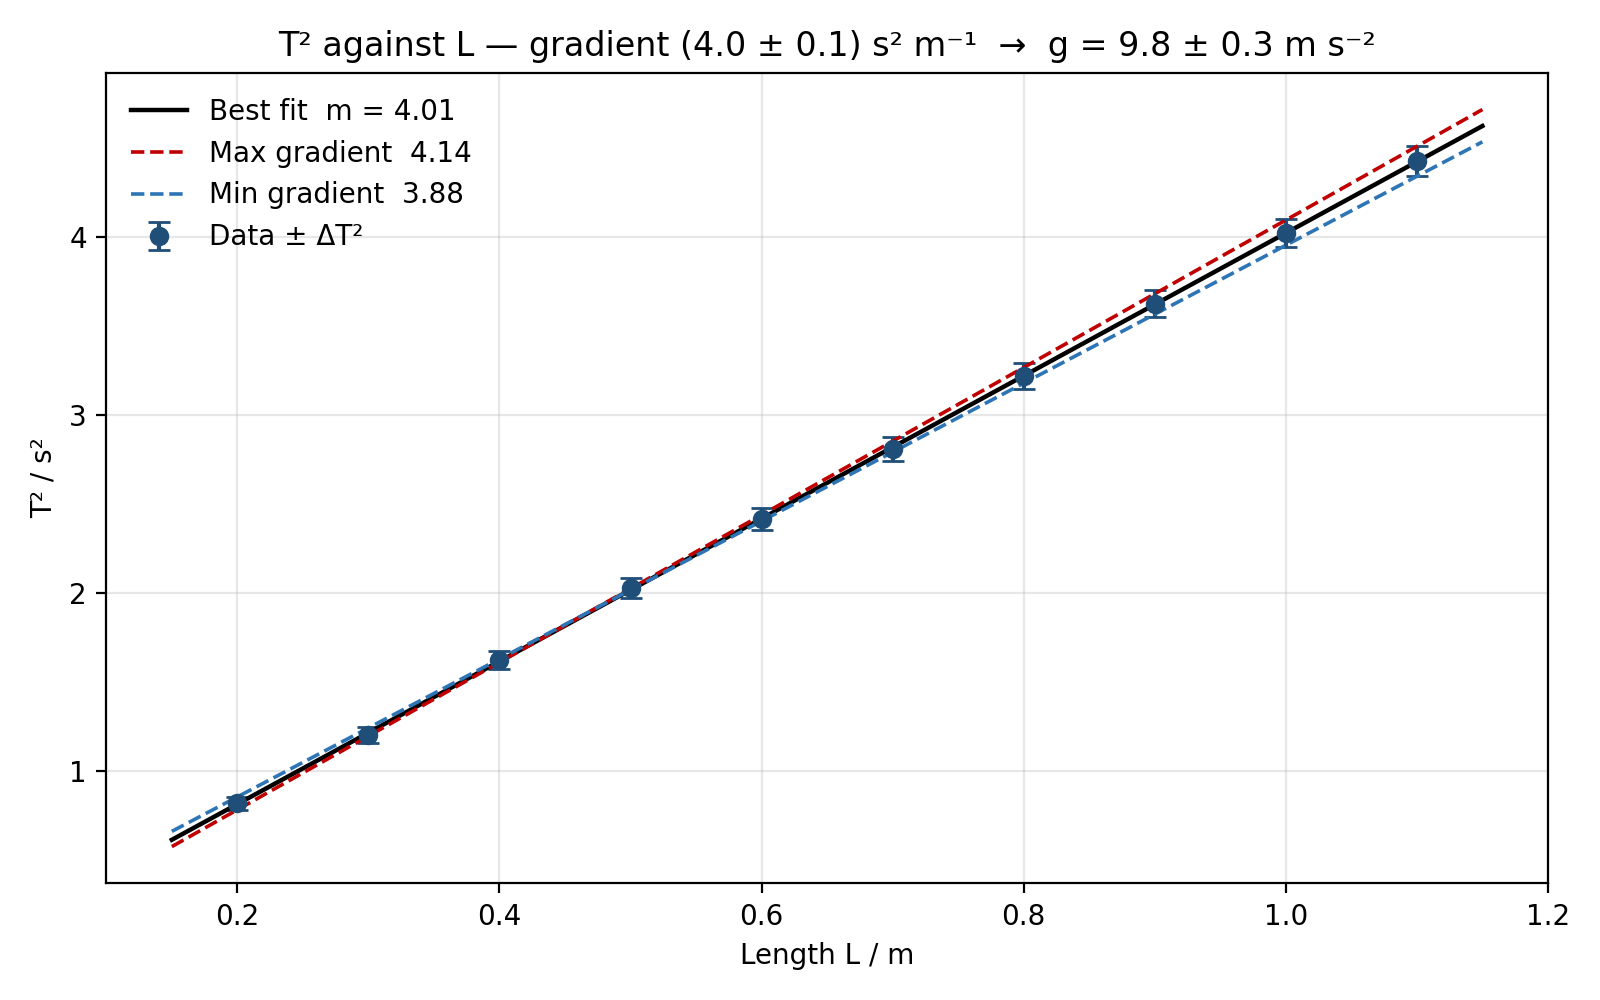
The loaded example: pendulum period against length. The sheet reports T² = (4.0 ± 0.1) L + (0.01 ± 0.06), so g = 9.8 ± 0.3 m s⁻², accepted value inside the range, intercept consistent with zero.
What it does
Why not a free tutorial?
A tutorial shows you one graph. This does the whole chain every time you change a number, applies the IB conventions (half-range from repeats, fractional uncertainties for products and powers, max/min lines through the first and last error bars, 1 s.f. on uncertainties), and hands you the rounded result. Every formula was verified against an independent calculation before release.
Questions
Does it work in Google Sheets?Yes — every number recalculates identically after File → Import. Sheets can't draw per-point error bars natively; the guide shows the two-minute workaround.
Is this allowed?It's a calculator, like Excel's trendline. Your research question, method, discussion and conclusion are yours. The checklist only makes sure you don't lose marks on presentation.
Who made it?Jeremy Norris — physics instructor with an engineering background. Drafted with AI assistance; every formula and worked value checked by hand and in code.
Refunds?If it doesn't produce your graph and uncertainties, reply to your purchase email within 14 days.
Get it
Student licence — $19 Teacher class licence — $39
Checkout by Lemon Squeezy (card, Apple Pay, Google Pay). Files arrive by email immediately.